SocioCortex Visualizer
A configurable model-based data dashboard solution which fosters transparency of the information flows from the enterprise data sources to the numerous stakeholder-specific dashboards in the organization.
The SocioCortex Visualizer as part of the umbrella project Spreadsheet 2.0 is a web-based tool access the data in SocioCortex and visualizing it in dashboards. In this context, a dashboard describes one web-based view consisting of one of more visualizations of potentially different types.
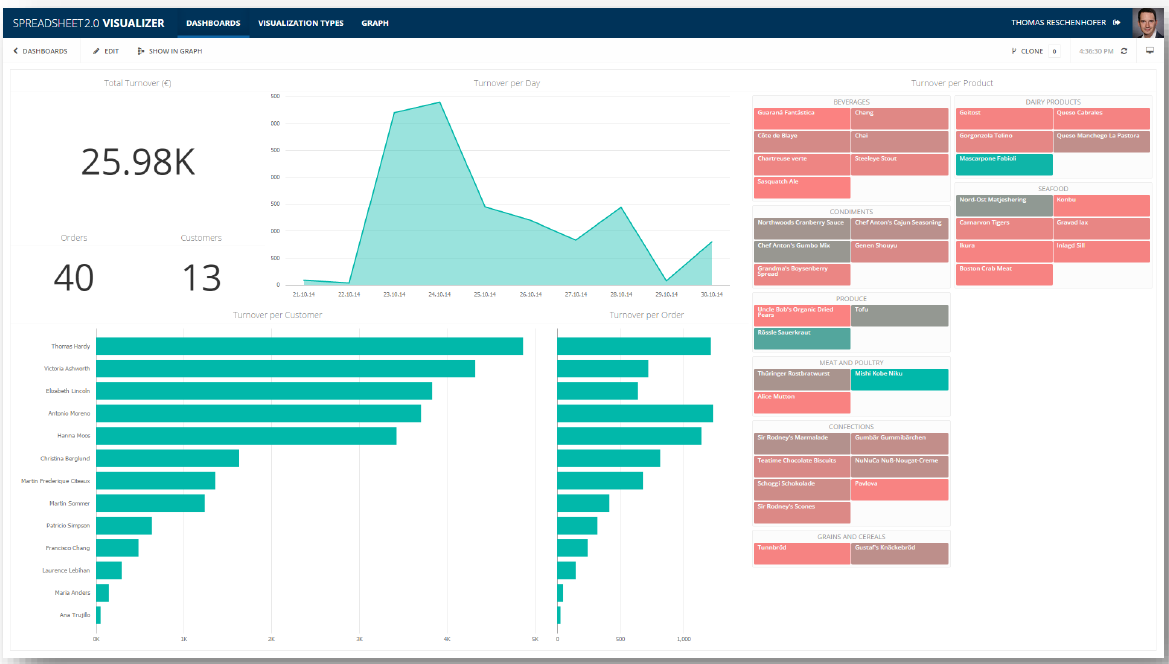
Motivated by the spreadsheet paradigm, which is the customizability of data analyses and visualizations by end-user, the dashboard can be easily configured at runtime. This means, that users can rearrange, add or remove visualizations to the dashboard. Furthermore, each visualization can be configured separately, i.e., users can adjust each visualization’s data bindings and visual properties.
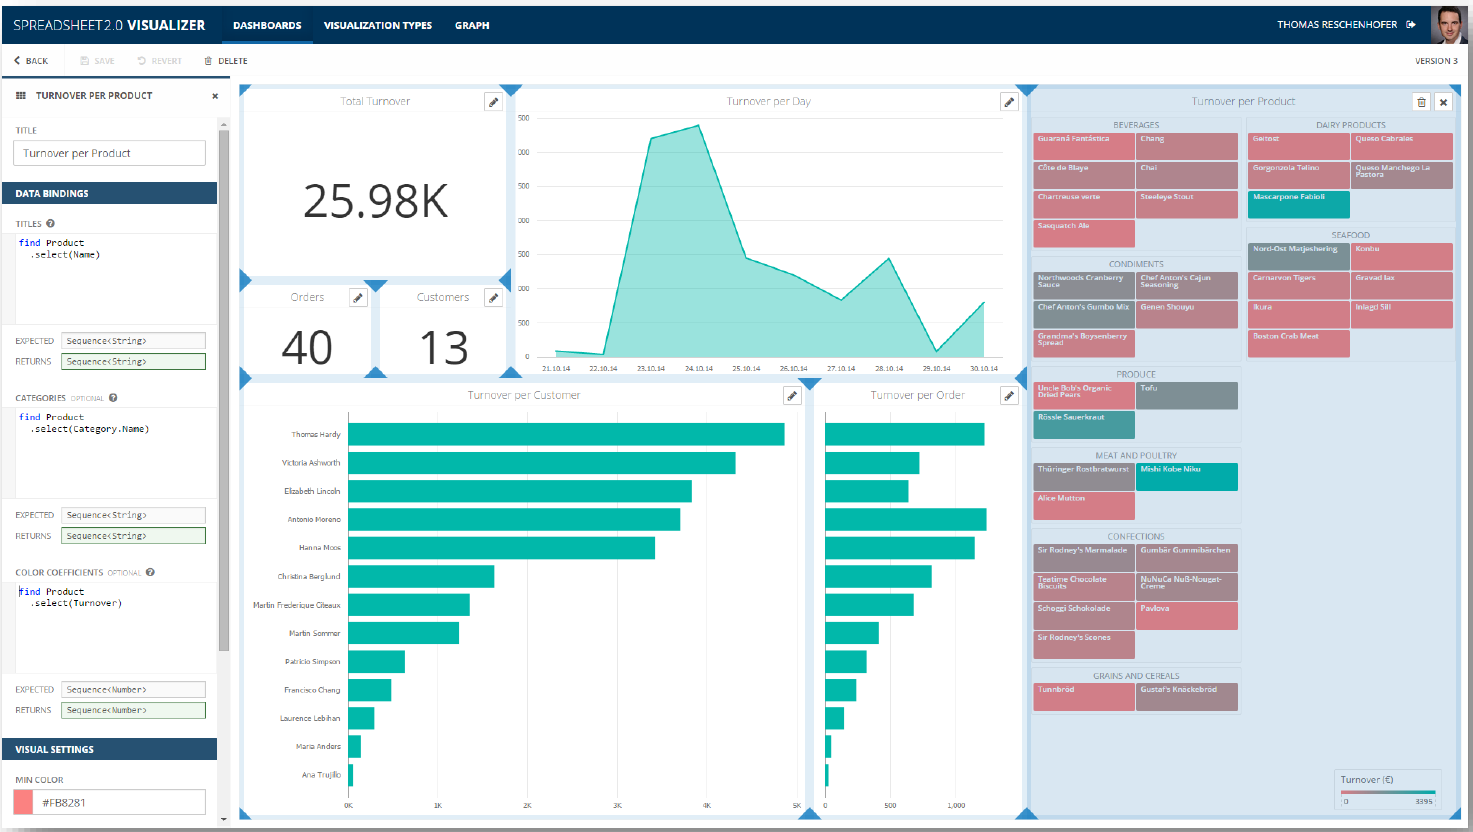
In the SocioCortex Visualizer, the data binding is defined by using SocioCortex’s model-based expression language (MxL). By MxL, users can access and query the data model as defined in SocioCortex, transform its data, and adjust it in accordance to the interfaces as specified by the respective visualization type. Since MxL is statically type-safe, an analysis of the expressions and validation of their static semantics can already ensure consistency with respect to the underlying data model.
For example, a Pie Chart has two data bindings: A list of names defining the labels of the pie’s pieces, and a list of numbers defining their size. The MxL’s static type safety enables the SocioCortex Visualizer to check an expression entered by an end-user with respect to its conformity with the visualization’s interface, i.e., if the expression returns a list of strings or numbers respectively. In this sense, the user is supported configuring the visualizations in a consistent and safe way.
Based on the data bindings of visualizations as well as other data transformations defined by MxL, SocioCortex can automatically generate a data flow graph. The SocioCortex Visualizer provides this graph to the user, including futher meta data for each of the graph’s nodes, e.g., owners of visualizatons and dashboards, editors of transformations.
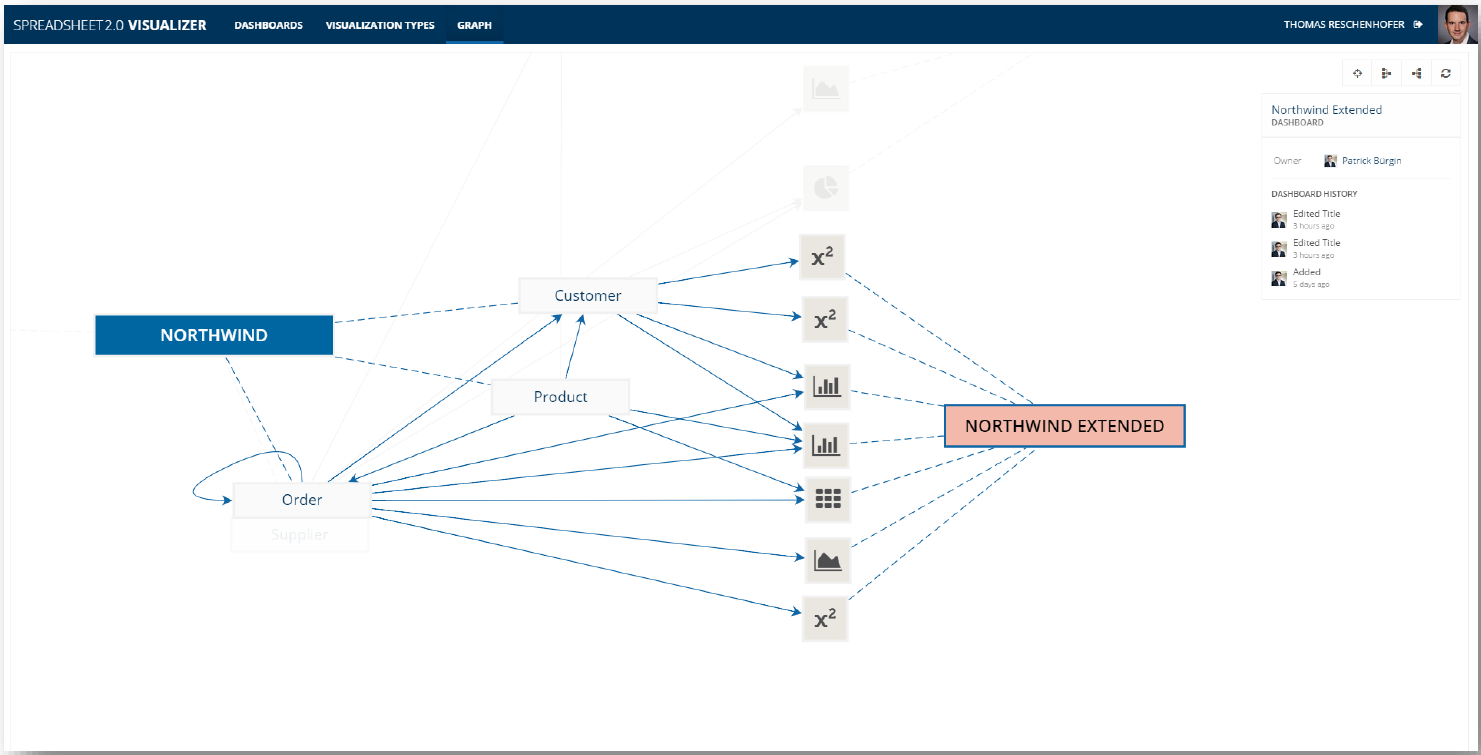
This data flow graph enables the implementation of multiple use cases, e.g., impact analysis (which visualizations are affected when changing a certain data field), documentation of the information flow to address compliance demands, or stakeholder identification.